The Apache Hop team released Apache Hop 2.3.0 yesterday.
A new Execution Information Logging Platform in Apache Hop

Why Execution Information Logging?
Execution Information Logging is one of the major new features in the Apache Hop 2.1.0 release. What exactly is execution information logging, and how does it help you as an Apache Hop user?
Developing workflows and pipelines is an important aspect of a successful data project. However, the goal of any data project is to be deployed to production and to process data repeatedly and correctly.
Apache Hop helps you where possible to guarantee your data workflows and pipelines do exactly that: focus on what you want to process your data instead of how through visual design, verify your data is processed exactly the way you want it with unit tests, manage your project's life cycle through separation of code (projects) and configuration (environments).
All of these actions let you work proactively: visual design lets you build pipelines that are easy to understand, projects and environments help you to quickly and easily deploy to multiple environments, and unit tests let you build tests for problem scenarios you know or expect.
While working proactively is great and an absolute necessity, reactively finding out what is going on can't be ignored. Basic logging and monitoring was already possible in Apache Hop, but 2.1.0 takes a major leap forward with the introduction of a new execution information and data profiling platform.
Finding out what happened during workflow and pipeline execution is crucial to understand how your data flows through your project. The new execution information platform does precisely that.
How does this work?
As the name implies, Execution Information Logging allows Hop users to store workflow and pipeline execution information, but there's more.
A lot more, actually. Let's take a closer look.
The new workflow and pipeline execution platform decouples the actual workflow or pipeline execution from the client (Hop Gui, hop-run, Hop Server) that executes it. You can now for example start a pipeline through hop-run on a remote server, and follow up on its progress through Hop Gui.
The execution information and data profiling add various new metadata items and metadata options to your Apache Hop installation:
- 2 new metadata types in the metadata perspective:
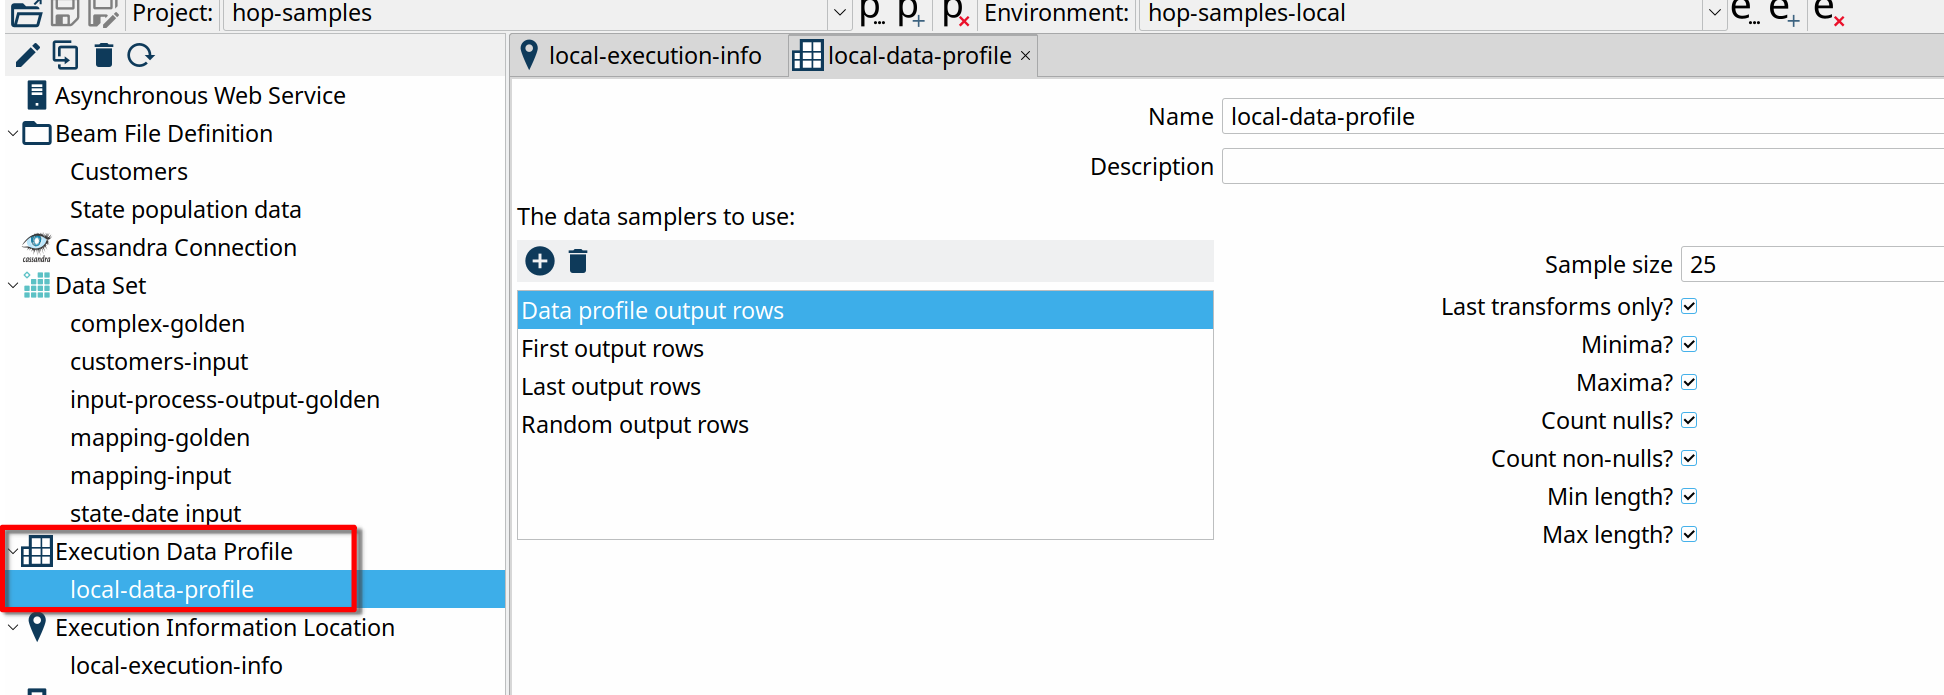
- the Execution Data Profile lets you configure a number of data samplers to use. The available samplers let you specify first, last or random rows, and let you configure the profiling: include minima, maxima, nulls etc
- the Execution Information Location lets you configure where and which delay, interval and row size you want to collect execution information. Supported locations currently are a folder on your local file system or on a remote Hop Server and a Neo4j graph database.
- the Pipeline and Workflow Run Configurations now have new options to configure the execution data profile and information location we just discussed:
- Execution Information Location (workflows and pipelines): select an execution information location, as specified in the metadata perspective (see metadata types above)
- Execution data profile (pipelines only): the execution data profile to use with this pipeline run configuration.
- an entirely new Execution Information perspective allows you to explore previous workflow and pipeline executions. This perspective lets you investigate previous executions of a workflow or pipeline in great detail, including the parameters and variables used, execution times, data profiles etc. The perspective also lets you drill up to or down from a given workflow or pipeline to its parent or child item. All execution information is available as it was in Hop's internals during execution.
- a new Execution Information transform lets your read back previously gathered execution information for further analysis.
Execution Information Walkthrough
We'll walk through the basic steps to capture execution information and data profiling on your local system and explore the results after some executions.
As discussed earlier, we'll start by creating metadata items for our Execution Information Location and Execution Data Profile.
The Execution Information Location metadata type takes a couple of parameters:
- Name: the name of this execution information location. This name will be used to refer to this location.
- Description: the description to use for this execution information location
- Data logging delay (ms): this delay determines how long Hop will wait (in milliseconds) before starting to write logging information.
- Data logging interval (ms): this interval determines how long Hop will wait (in milliseconds) before writing the next set of logging information
- Data logging size (rows):
- Location type: execution information is either logged on the local file system or sent to a remote server.
- File location is the root folder where your execution information will be stored as a set of JSON files, in a hashed folder per execution.
- if your select a Remote Location, you'll need to specify a Hop Server and the Execution Information Location on that server. The configuration for this remote execution information location on the server will determine where your execution logging will be written to.
To get our basic execution logging configured, go to the metadata perspective, right-click and select "New" on "Execution Information Location" and enter the following parameters: execution-logging as the name, File location as the location type and "${PROJECT_HOME}/logging/execution-logging" as the Root folder.

Creating a data profile is similar: right-click the "Execution Data Profile" in the metadata perspective and hit "new". Give your data profile a name, "local-data-profile" in the example below, and add the samplers you need. We've added all available samplers in the example below, with the default options.

The last thing we need to do is enable execution logging and data profiling in the pipeline and workflow run configurations. We'll use Hop's native engine for this example, but the same configuration options are available for any of the supported Beam pipeline engines.
Open your local run configuration settings (right click -> Edit or double click) and select the Execution information location and Execution data profile we just created. Your workflow Run Configuration settings are similar, the only difference is that data profiling isn't available for workflow run configurations.

You now have everything in place to start collecting logging information and data profiling information. After you've run a number of workflows and pipelines, you'll have execution logging and data profiling information available in the folder you configured.
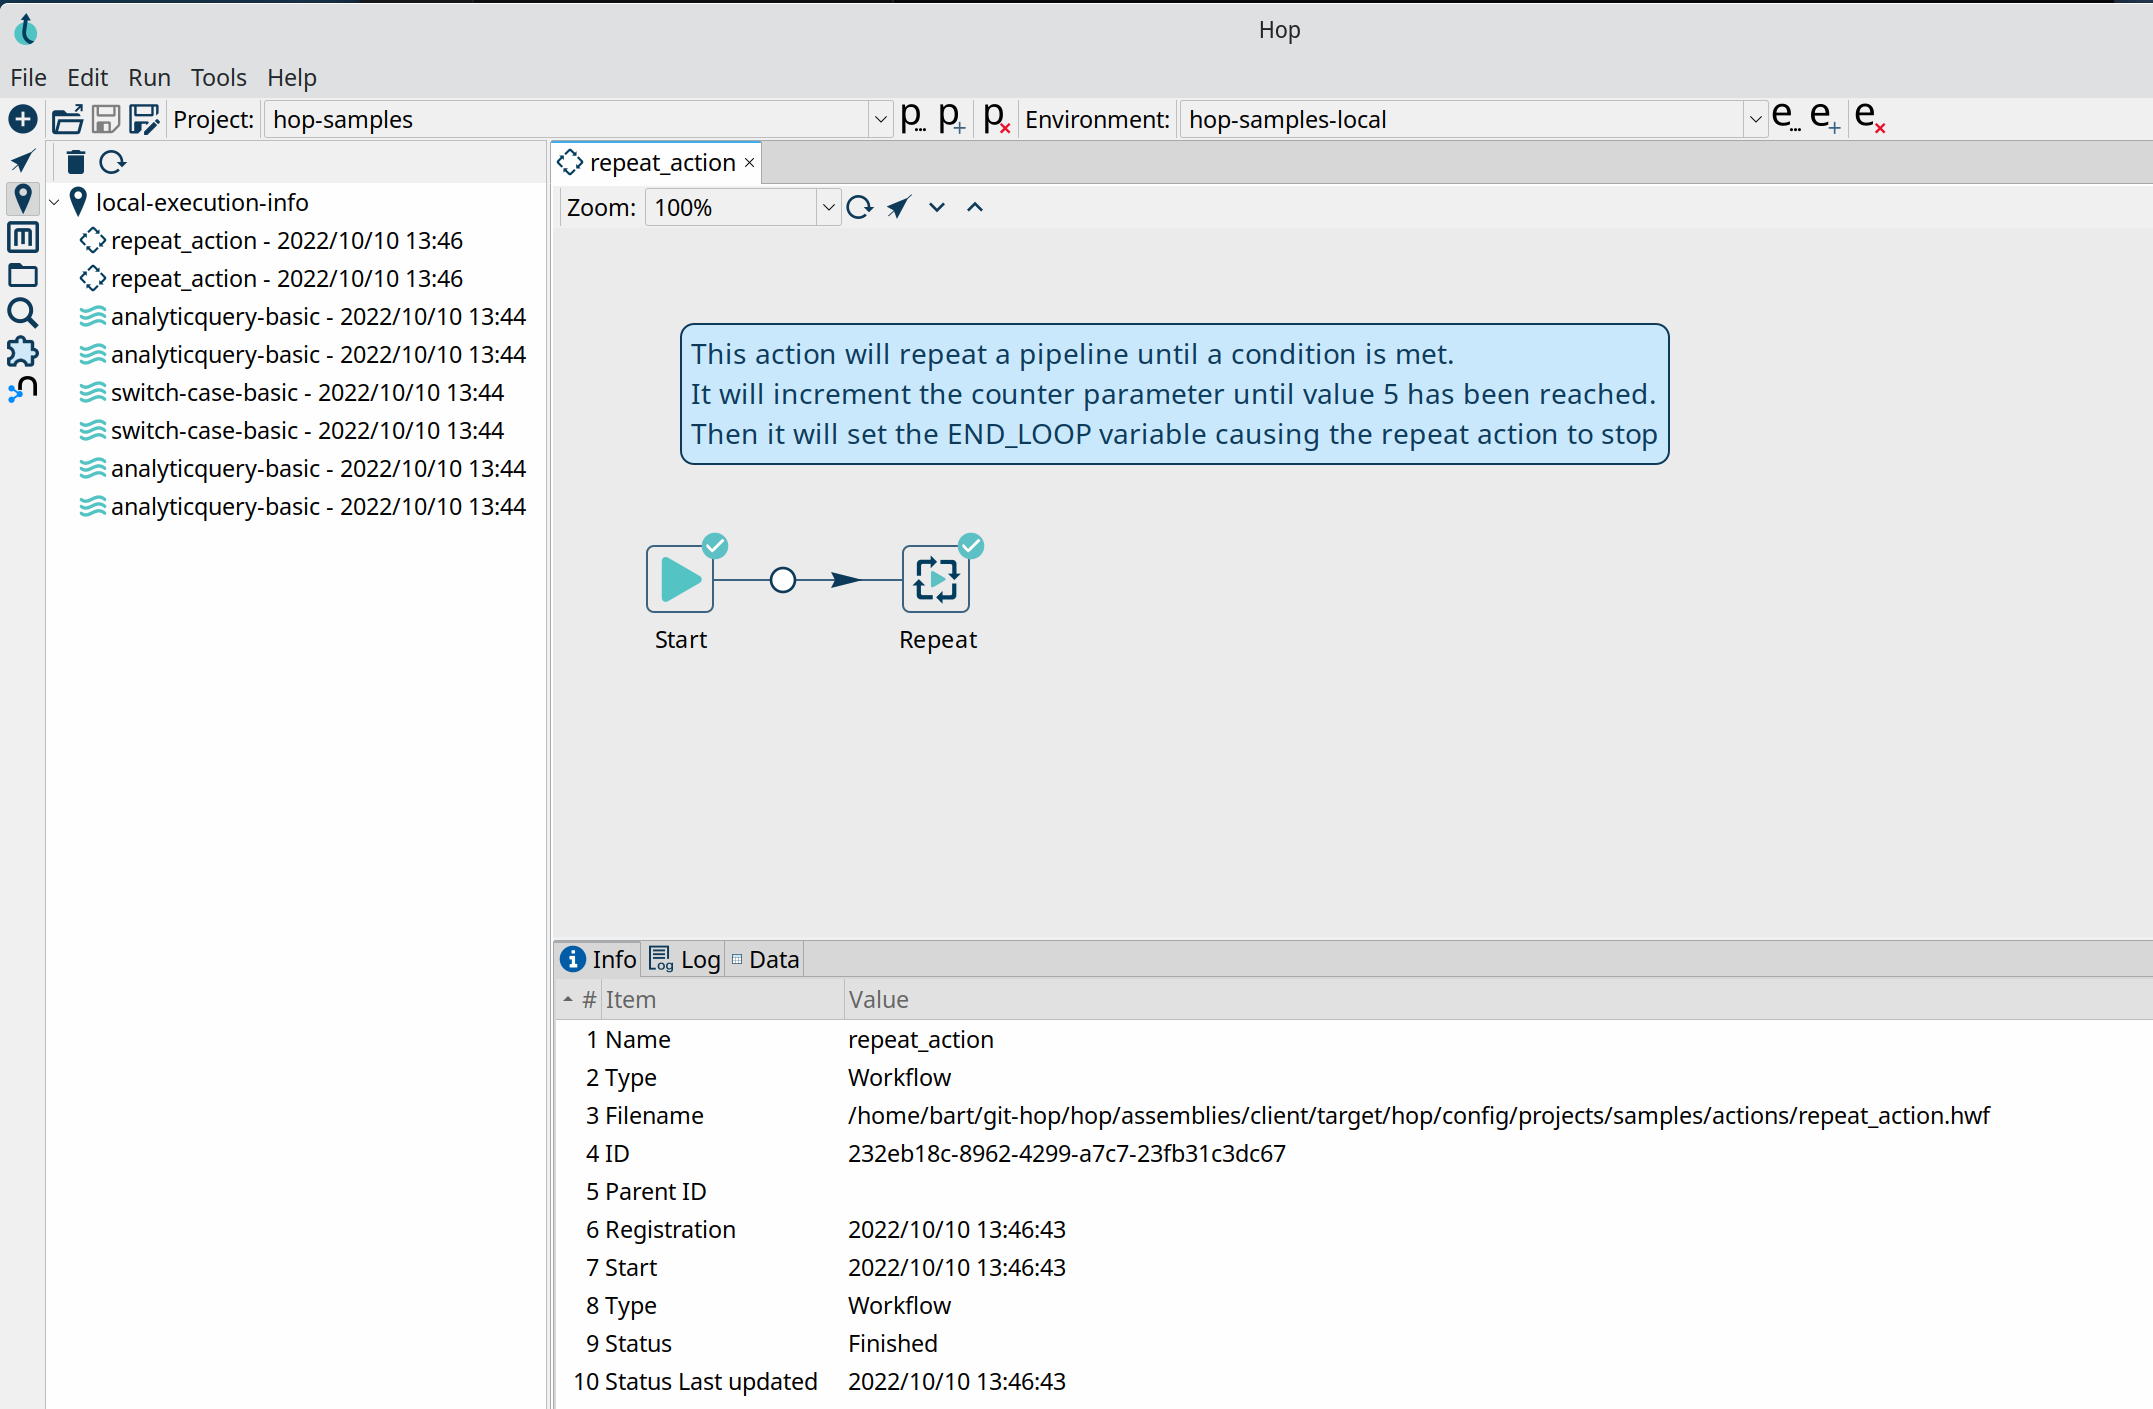
Switch to the Execution Information perspective to explore the information you just captured.
In this example, we ran a couple of pipelines from the samples project:

The Execution Information provides a ton of information:
The workflow or pipeline view allows you to drill up or down to the parent or child pipeline or workflow. Select an action or transform and hit either the drill up or down icon to go to a parent or child execution. The arrow button left to the drill up and down buttons takes you directly to the workflow or pipeline editor.

In the lower half of the perspective, you'll find the Info, Log, metrics (pipelines only) and data tabs:
- Info contains execution information about the execution of your workflow or pipeline: in addition to the name, id and parent (if available), you'll also find the start and end date and its status.
- Log contains the full log output of your workflow or pipeline
- Metrics (pipelines only) contains the metrics gathered for a particular transform in your pipeline
- Data contains the profiled data for the selected transform or action.
Even though you won't ever need to change or even consult the raw execution or profiling data directly, it is available as a set of JSON files on your local or server file system: A separate folder (with a hash for the execution as the folder name) is created for each execution, with the following files:
- all-transforms-data.json contains the profiling data for the transforms in a pipeline
- execution.json contains the information that is shown in the Info tab
- workflow-log.txt or pipeline-log.txt contains the full log for a workflow or pipeline execution
- state.json keeps track of the workflow or pipeline state during execution.
As always, we'll be happy to help you get the most out of Apache Hop.
Get in touch if you'd like to discuss running your Apache Hop implementation in production, training or custom development.


Blog comments